No vaccine paragraph this week - but some greenish material. Was looking into windfarms and ended up with GHG emission datapoints. At the end I add some e-commerce and data M&A.
Enjoy!
Last two weeks - I was digging through some greenish materials with regard to windfarms. It was mainly company related - but refreshed some other datapoints along the road. In no particular order:
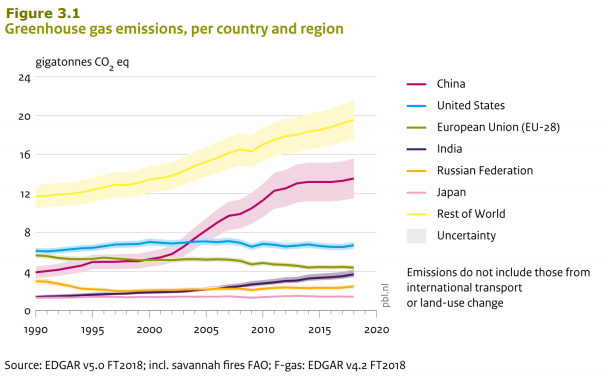
First, I bumped into this paper which actually nicely sums up some datapoints with regard to global greenhouse gas (GHG) emissions and energy use. CO2 (70%) and CH4 (methane - 20%) are the two main drivers of GHG emissions:
GHG emissions for several countries/regions throughout the years:
Second: The Economist cover story this week is about Coal’s Endgame (while there September issue was also titled 21st Century Power).
In general with regard to coal:
about 40% of global CO2 emissions are related to coal (link for visualisation)
coal has about 800-ish gCO2 eq/kWH (which is high)
coal is in decline in most Western Countries but still big in China: total primary energy supply (TPES) is 55% coal, 21% renewable/nuclear (with a big increase of wind/solar last years), 17% oil and 7% nat gas.
The global peak of coal-fired capacity masks divergent stories in different countries. In the West, countries whose economic ascent was powered by coal and colonialism have been reducing their coal use for years and are shedding capacity with gusto. In South America and Africa - South Africa apart - coal has never been a big part of the energy mix. But Asia’s largest countries depend overwhemingly on coal for the electricity their economies need, an they are still adding capacity.
Yet coal-plant construction shot up in 2019. And in the first five and a half months of 2020 provincal governments, keen to boost employment and economic growth, gave companies permission to add a further 17GW of new coal capacity.
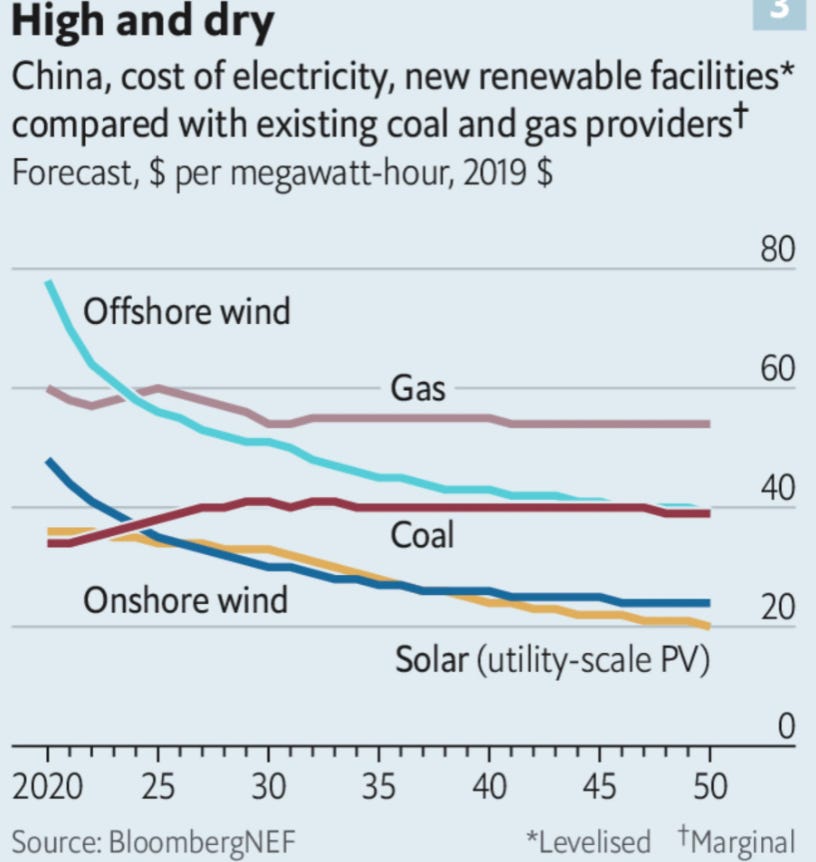
The article also contains a nice graph from Bloomberg NEF with regard to LCOE (Levelized Cost of Energy) which shows LCOE of wind and solar is in decline.
Third: the US energy flowchart from LLNL remains a fascinating visual summary imo:
24% industry of which iron and steel (7%) is the biggest one
16% transport of which 12% road of which 7% passenger travel
17% buildings
18% agriculture, forestry & land use
5% industry use (as an input for cement for example)
Back to wind: how much capacity is there worldwide? (Lots of articles source their data from the Global Wind Energy Council or Wind Europe for example)
In total there is about 650 GW installed capacity worldwide. Asia leads regionally - before Europe and the USA. Almost all installed capacity is onshore (versus offshore).
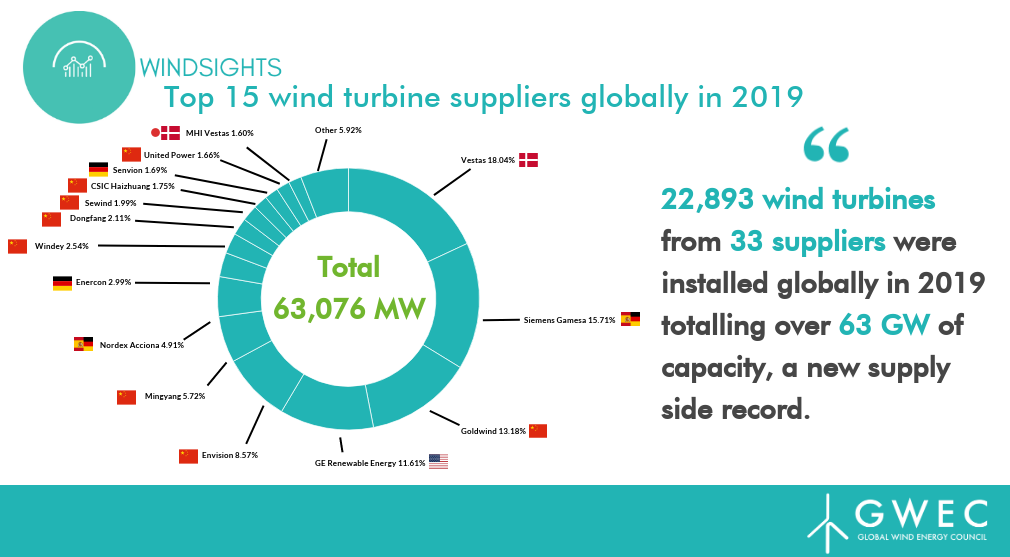
Capacity has been growing steadily the last couple of years with about 50-60 Gw per year (link). Btw: the capacity addition of last year represents about 23,000 wind turbines.
Future capacity forecasts (for example from GWEC and Wood Mackenzie) are around 60-70 GW additions in the coming years. Offshore will grow faster than onshore.
Next: who owns these windturbines?
About 15 companies own 36% of total capacity - seven of them are Chinese state-owned power generators. Within China these seven players own 60% of all capacity.
Danish Orsted is the number one offshore wind farm operator, with 3,7 GW of the capacity under ownership. The company is the only actor in the sector with offshore wind assets located in European, Asia Pacific and North American waters. (link)
Next: who builds these windfarms? There are about 30-ish players globally. If we look at 2019 installed capacity the top 5 are: Vestas, SiemensGamesa, Goldwind, GE and Envision. At first sight the products itself are not really differentiated because they all talk about their 2, 4, 6,… MW platforms. There are differences of course in terms of activity or latest product. For example Vestas is more onshore versus SiemensGamesa which is more offshore.
Besides the product, the companies offer a service afterwards. Intuitively this feels like a elevator service contract but if I understand correctly different OEMs take care of different OEM’s windturbines afterwards. And software attached to it can also be sourced from different sources.
To finish: a big part of the wind turbine discussion/pricing is subsidy driven. In 2019 - about 35% (onshore) capacity was market-based:
Interesting take on e-commerce growth. (I believe the 27% number excludes certain categories like cars - because the broad US Census number is around 16%).
Basically, there is a temporary positive effect due to the denominator. I quickly pulled the chart from the US Census (numbers are in million dollars and are US retail sales):
Recently, some big M&A deals were announced/closed. Salesforce is buying Slack. And in the financial data world, there are some big moving parts:
S&P Global buys IHS Markit:
In the meantime, LSE also seems to have gained approval for the Refinitiv deal. Earlier, LSE sold Borsa Italiana to win regulatory approval.